Using VsCode to debug c++ project on WSL with intellisense and breakpoint support.
Folder: $MY_ROOT = /mnt/s/Rio/proj/linux/IdeVscode has dbg/ for output files, make/ for source and config files.
1.Installation: since I am running on WS2, I installed extension “Remote – WSL 0.51.4”. Then I installed extension “C/C++ 1.1.3”
Entry point is $MY_ROOT/ide.code-workspace, “path”: “/mnt/s/rio/proj/linux/IdeVscode/make” which is ${workspaceFolder}
2. launch vscode, and open workspace ide.code-workspace
${workspaceFolder} has: head.h main.cpp as test source files and .vscode, which has the key files explained below.
3. build the project to generate executable file $MY_ROOT/dbg/elfVscode click pressing Ctrl-Shift-B, or palette: Tasks Run build task
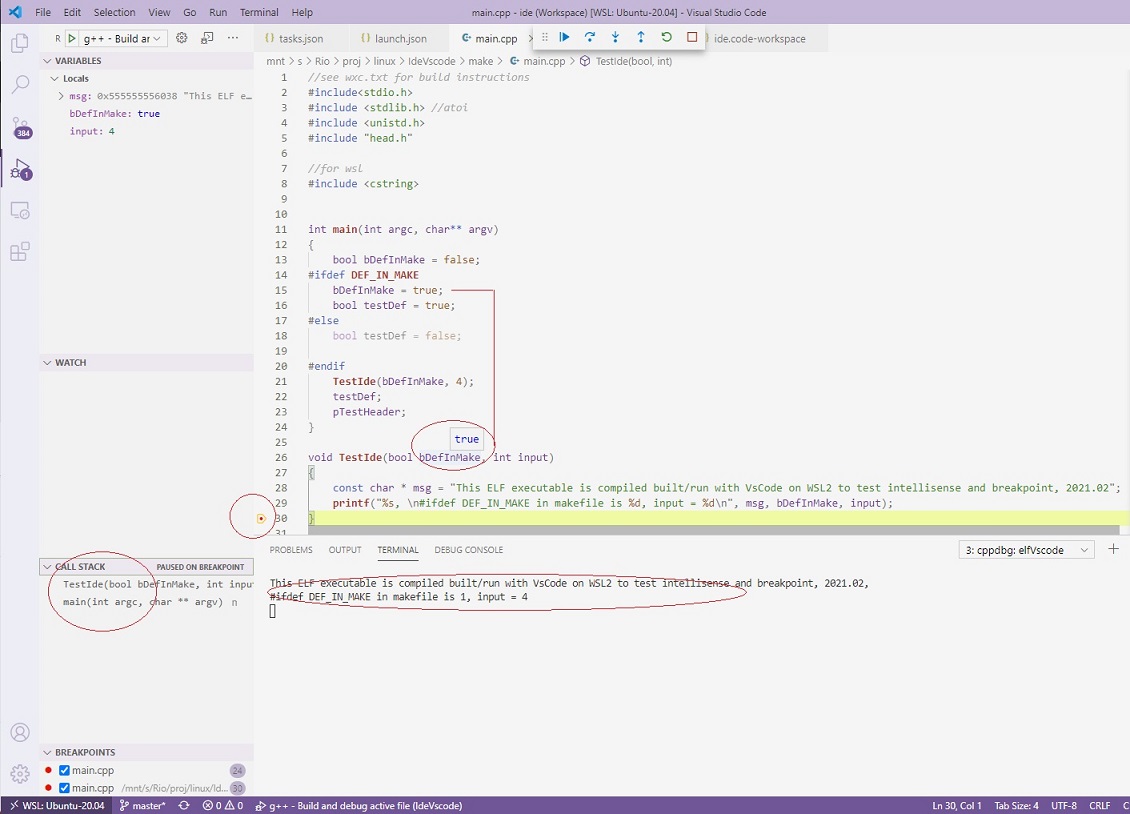
4. set breakpoint by clicking the left area of source code file.
5. run: Ctrl-Shift-B or: click the Run tab at very left, then the triangle button at top. program stops at breakpoint and variables can be inspected.
6. intellisense: right click testDef and choose “go to definition”, it detects ifdefine and go to the right location.
${workspaceFolder}/.vscode has the key config files:
launch.json: “program” tells which executable to launch
tasks.json: how to build the executable, like “command” tells about /bin/g++ , “args” tells about main.cpp and the ifdef
c_cpp_properties.json: have similar info as tasks.json, but used by intellisense instead of build task.
It seems the new extension, “ms-vscode.makefile-tools”, can cover both tasks.json and c_cpp_properties.json, but it’s still in preview.
download: http://riowing.net/p/wp/IdeVsCode.zip
screenshot: scrIde.jpg